Background.
Nitrate is a small, simple molecule that is soluble in water. (more info) It occurs naturally in rivers and lakes at low levels. Human activity, notably farming and disposal of treated sewage, can greatly increase those levels. Excessive nitrate levels cause a wide range of ecological problems. In the Takaka catchment this applies equally to the Arthur Marble Aquifer, source of the outstandingly clear water in Te Waikoropupū Springs. Experts at NIWA have advised that nitrate is a key factor in the health of the aquifer and the Springs.
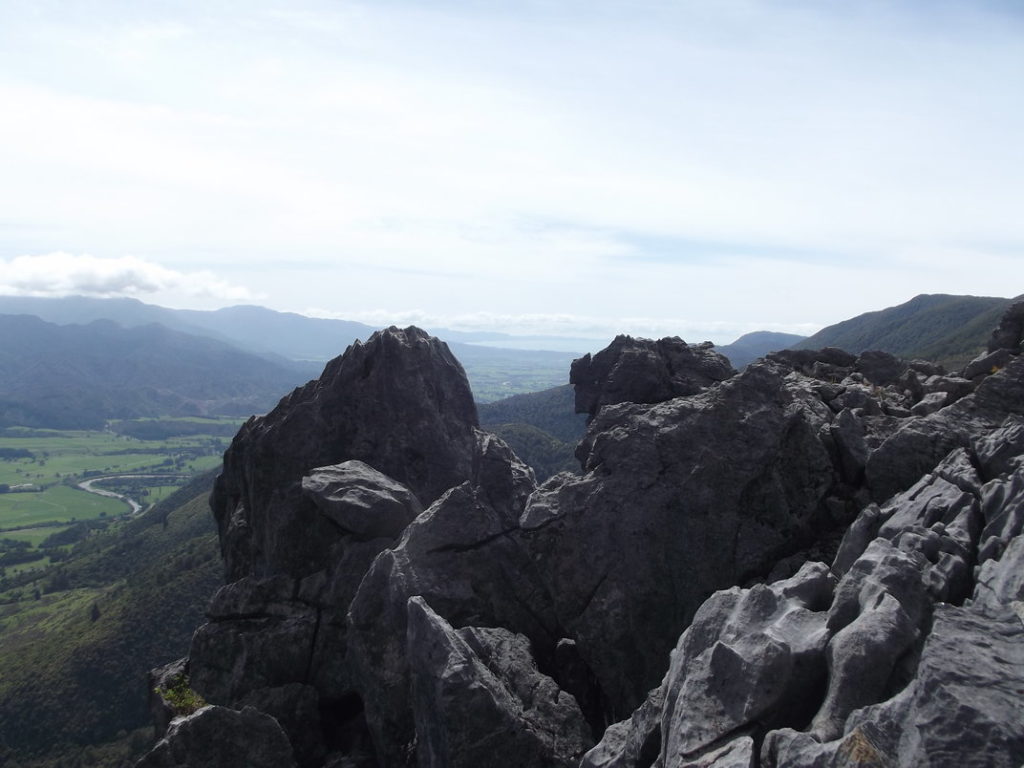
< An outcrop of Arthur Marble on Takaka Hill. This marble also lies deep under the Takaka Valley, and holds the marble aquifer that supplies Te Waikoropupū Springs.
Friends of Golden Bay has been monitoring the nitrate levels at three sites in Te Waikoropupū Springs Reserve for over four years. For two years we monitored every week. On reviewing those results we decided to monitor fortnightly, and to extend our programme to include the water entering the Takaka Valley
Why are we monitoring Nitrate?
Nitrate is a crucial factor in the health of groundwater. In 2015, discussions in a group appointed by Tasman District Council (the TDC Takaka FLAG) revealed uncertainty over the actual nitrate levels in Te Waikoropupū Springs, and whether the trend was up or down. At the time, the available data was from the National Groundwater Monitoring Programme, which analyses water from Te Waikoropupū every 3 months. The group agreed on more frequent monitoring, but TDC subsequently decided not to fund it. Friends of Golden Bay considers it important to have the facts, so we established our own monitoring programme. We give our results to TDC and other interested parties.
The results
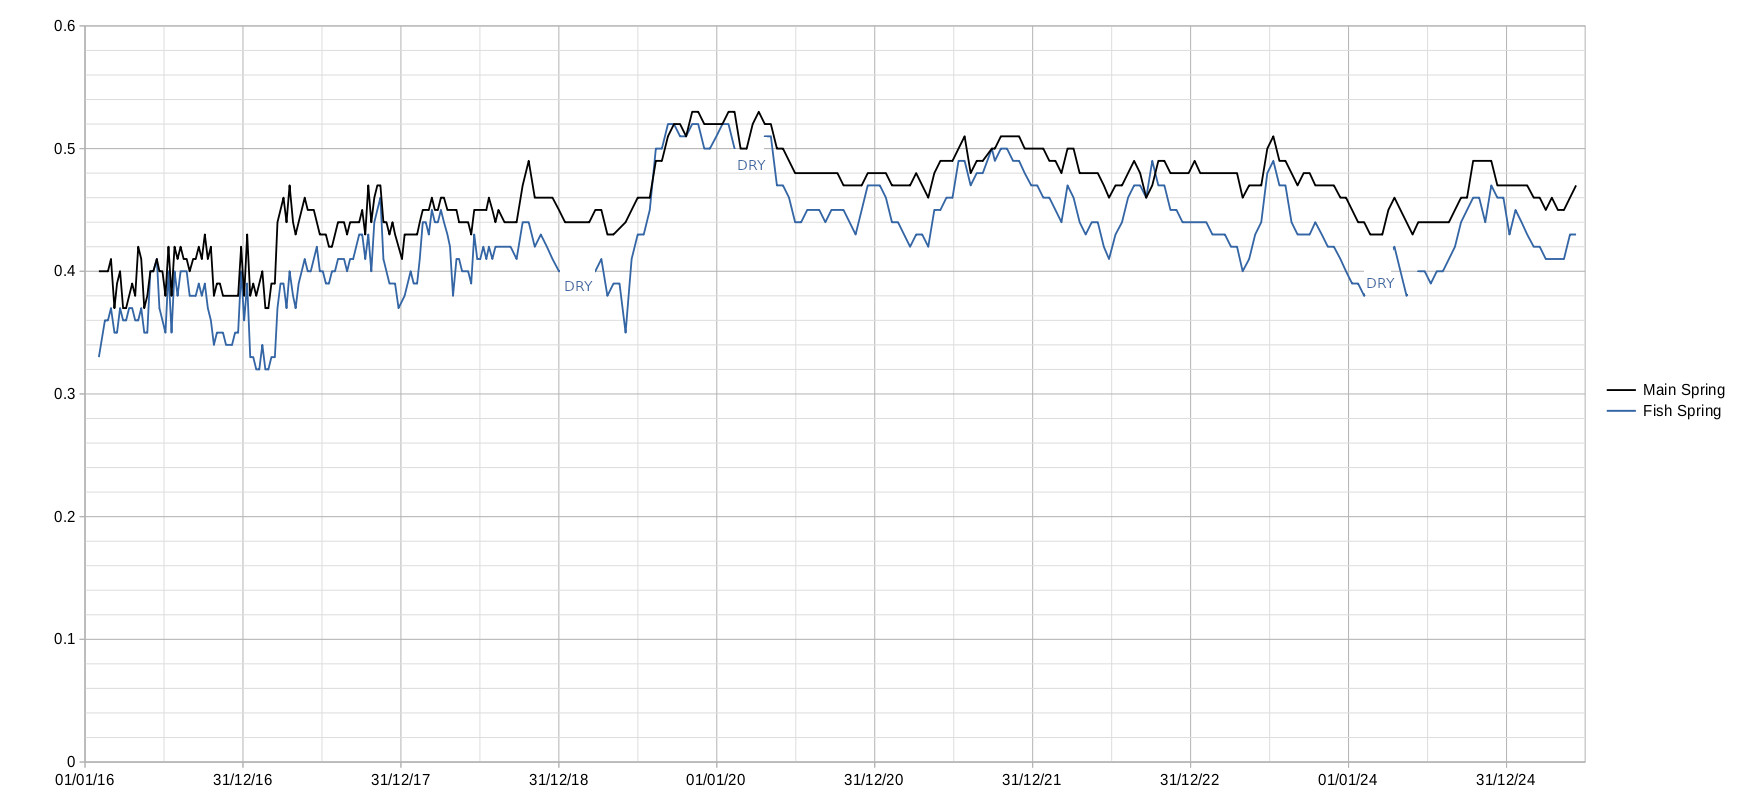
The graph below shows the nitrate levels in Te Waikoropupū Main Spring, and Fish Spring, from February 2016 to the present. (Updated 25 Jun 2025.) The units are milligrams of nitrate-N per litre (mg/l).
 Comment on the results
1 The level of nitrate has increased over the eight years. The level in the Main Spring has risen from 0.40 mg/l in 2016 to 0.53 mg/l in the latter part of 2019. For the last three years it has hovered around 0.50 mg/l, but this summer there has been a significant reduction.
2 With the exception of a few occasions in late 2019 and the Oct 2022 sampling, there has been a higher level of nitrate in the Main Spring than in Fish Spring. This was not known before because TDC has sent its samples from Main and Fish Springs to different labs using different analysis methods, which had led to the mistaken belief that Fish Spring’s levels were the higher ones. The correct information has important implications for our understanding of flows in the aquifer and what its sources are.
3 The nitrate levels in both springs only vary by small amounts from week to week, and over the entire 3-year period there have been no major departures from the average. This is also new information, because TDC’s long term record, from 1990 to the present, contains several ‘outliers’; readings in the range 0.8 – 0.9 mg/l. We believe we these outliers were caused by accidental contamination of the samples, which allows us to construct with confidence a more useful understanding of the long term trends.
4. Fish Spring can stop flowing dry during dry periods. During the these periods surface water flowing into the Fish Springs area has been seen descending into the ground where groundwater normally emerges.
Where does the nitrate come from?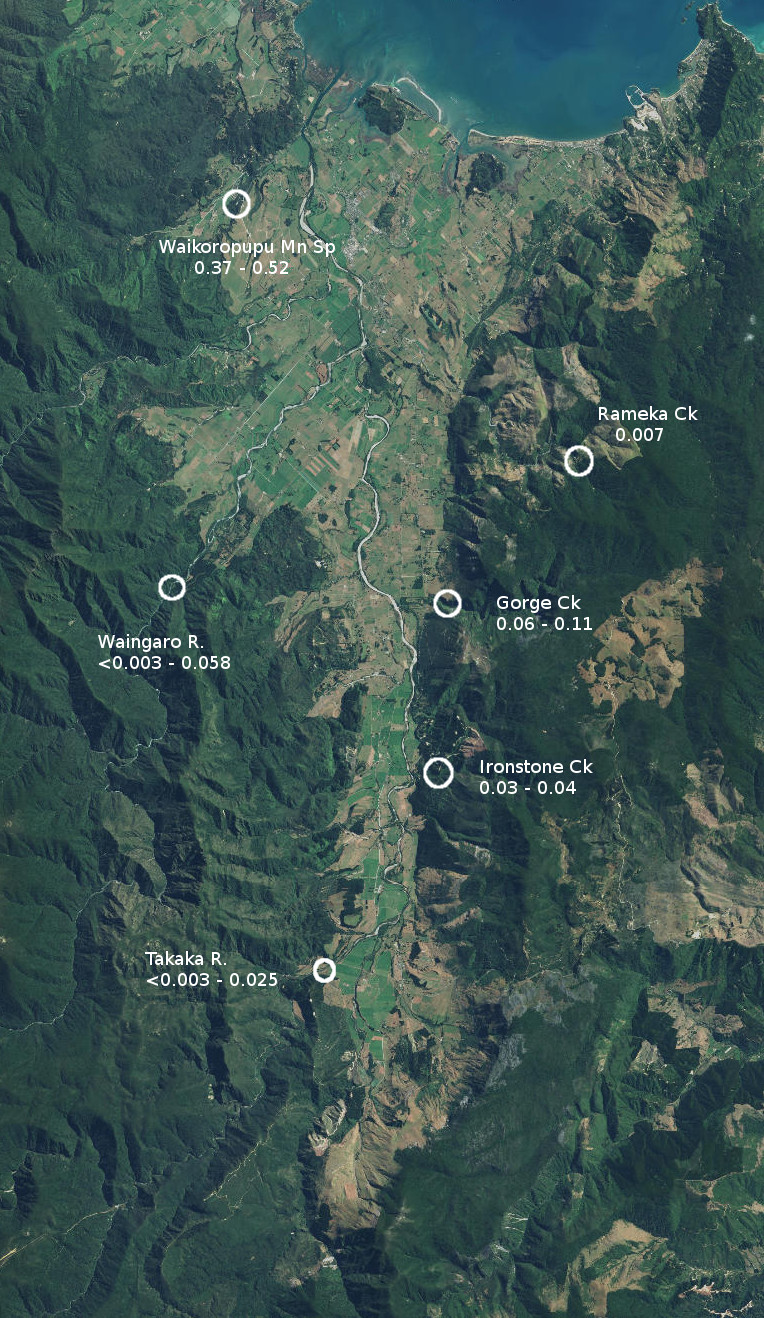
This question is of course highly political.
The short answer is that most of the nitrate in Te Waikoropupū appears to come from farming in the Takaka Valley. However it has taken a lot of patient research to establish this fact beyond reasonable dispute.
The other possibilities were that it is being weathered out of the bedrock; that it is a long term hangover from clearance of the forest last century; or that it is flowing into the Valley from the rivers and creeks. TDC had samples of rock from the Valley analysed and found they contained almost no nitrogen in any form, which ruled that one out. A detailed calculation of how much nitrogen could have been contained in the forest before it was felled showed that even if it had all somehow found its way into the ground and leached out at exactly the right rate, it still wouldn’t account for the levels seen.
Finally, Friends of Golden Bay took on a programme of sampling the rivers and creeks that flow into the Valley. A summary of the results is shown in the map to the right. (The nitrate levels are in mg/l of nitrate-N, as in the graph above.) By far the largest flows into the Valley come from the Takaka and Waingaro Rivers, and as can be seen, the nitrate levels in them are well below the levels found at Te Waikoropupū, frequently around 1/100th of that found at the Springs. For completeness we have also tested the creeks entering from the eastern side of the Valley, although they contribute far smaller amounts of water. Again, the levels are far below those at the Springs. It is instructive that Gorge Creek has slightly higher levels than Rameka Creek (sampled upstream of farming) and Ironstone Creek. This would reflect the farmed area in the upper catchment of Gorge Creek. (See cleared area on the map.) Note. The lab’s limit of detection is 0.003 mg/l and ‘<0.003’ means that it was less than that amount.
It is possible to do a ‘mass balance’ for nitrate-N in the Takaka Valley. The nitrate levels and flow rates of Main Spring and Fish Spring imply that the Main spring currently discharges some 140 tonnes of nitate-N per year and Fish Springs discharge about 40 tonnes. A similar calculation gives an estimate of nitrate-N flowing under the Kotinga Bridge (where TDC monitors nitrate) in the Takaka River, and the total is a fair estimate of nitrate-N leaving the Takaka Valley annually.